
BTS: 5 minutes to 25 ms
How a 130M+ Row PostgreSQL feed went from 5 minutes to 35 milliseconds

In high-volume e-commerce analytics, delivering real-time performance tracking to merchants is a hard technical requirement. Merchants expect to open a dashboard and see instantly whether a specific “Back in Stock” or “Price Drop” campaign generated meaningful revenue.
We recently tackled a massive performance bottleneck on one of our core feature feeds: the Sent Alerts Report. This report provides a dashboard with all the details of notifications that were sent out to the shoppers of a particular store. i.e If someone was alerted of a price drop via email, this report would have the product details, the email details, the date and status and also if it converted to an order.
The Dataset: 131 M rows (and growing).
The Core Bottleneck: Initial dashboard loads were clocking in at an unacceptable 305 seconds (over 5 minutes).
The Target:
Sub-second latency (~50ms) for any filter, search, or sort operation.
Sortable by sent date and revenue
Searchable by product name, SKU, product ID or user email
Filterable by click action, purchased filter
Here is engineering playbook of how we completely restructured our storage and query patterns on a distributed PostgreSQL (Citus) cluster to achieve a 6,000x speed improvement.
1. The Anatomy of a Slow Query: “The Real-Time Funnel Tax”
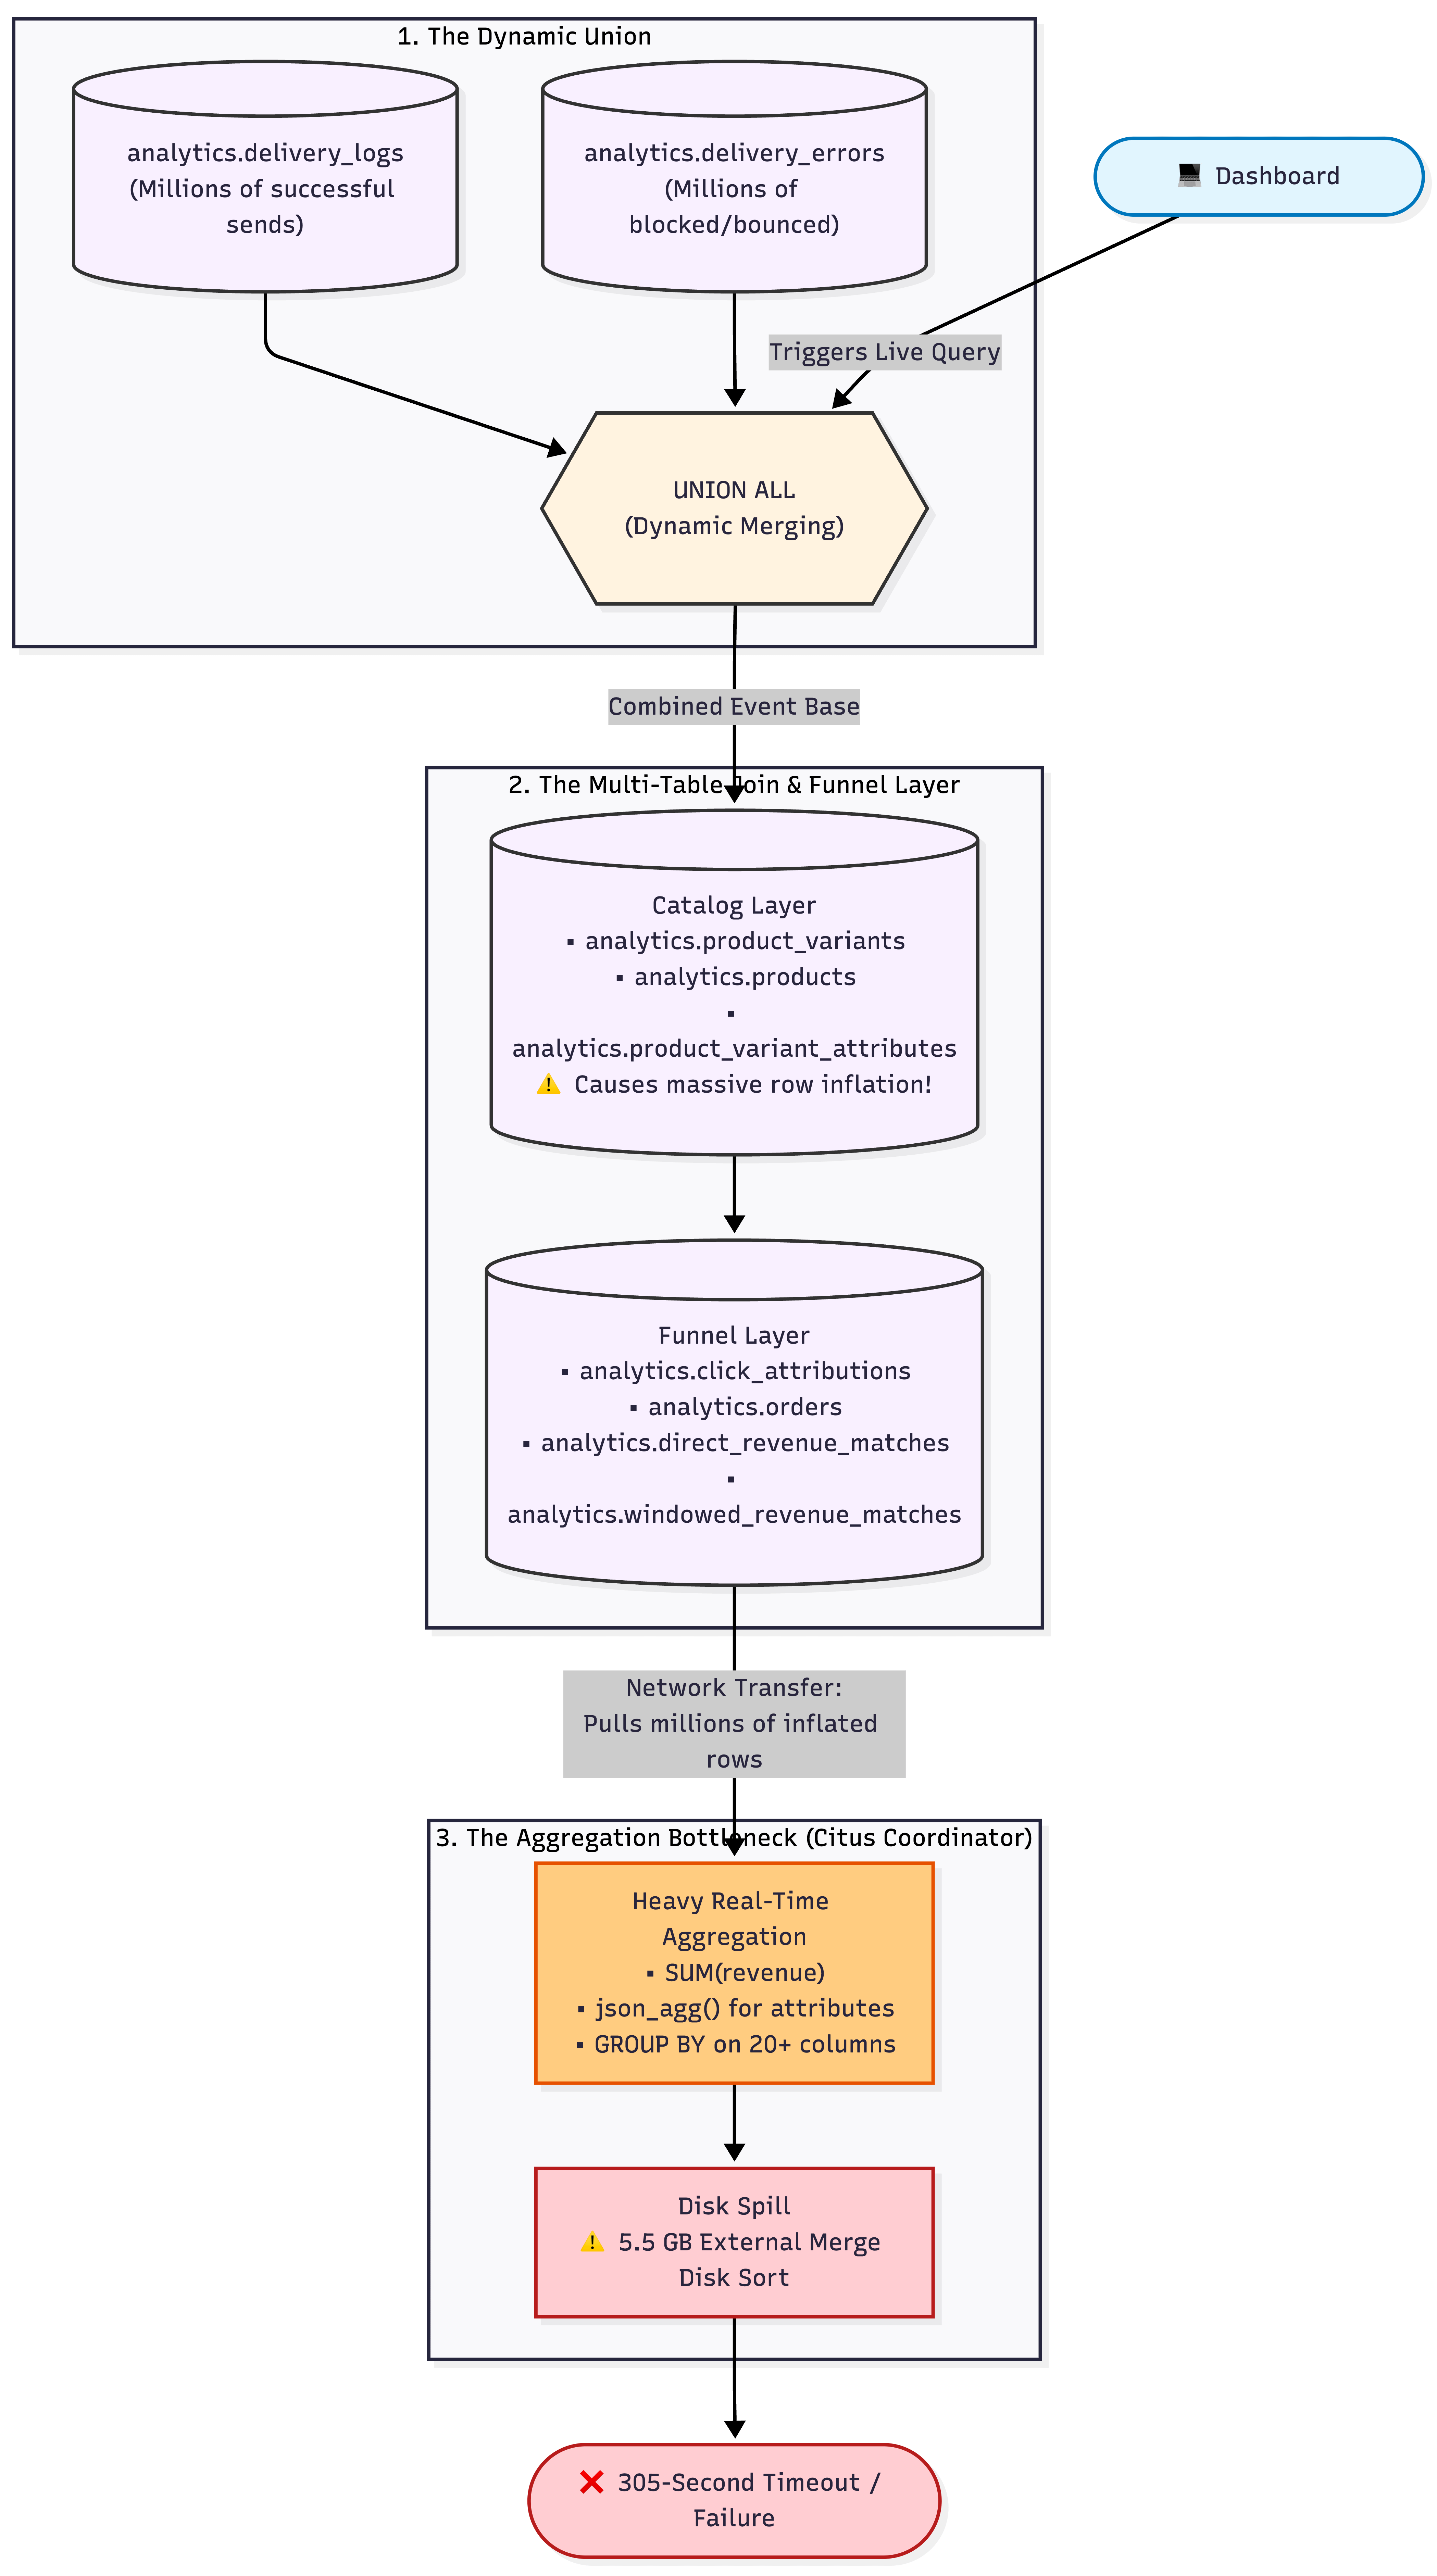
Our original query pattern followed a classic database anti-pattern. Every time a user loaded the dashboard, the database was forced to dynamically reconstruct the entire report from scratch across multiple massive tables:
The Live Funnel Stitching: To determine if a specific alert worked, it had to left-join raw dispatch logs against click attributions. Then, it joined those clicks to order records and multiple attribution revenue logs to calculate the financial ROI.
Row Inflation: It simultaneously joined those records against raw product catalog and variant attribute tables. Because a single product item can have multiple distinct attributes (e.g., Size: Large, Color: Red), a 5-million-row dataset exploded into over 11 million intermediate rows in memory.
The Real-Time Aggregation Penalty: To squash those inflated rows back down into a clean dashboard view, it performed heavy
SUM(order_line_value)calculations and ajson_agg()to bundle variant metadata. This forced a massiveGROUP BYon more than 20 long text strings and URLs.The 5.5 GB Disk Spill: Because the database couldn’t fit this massive, un-indexed intermediate dataset in RAM, it resorted to an
external merge disk sort. The coordinator node thrashed SSDs sorting millions of fully joined records just to return the top 25 most recent rows.
-- EXPLAIN ANALYZE snippet showing the carnage:
Sort Method: external merge  Disk: 5513880kB
Execution Time: 305439.394 ms  -- 5.09 minutes!
Step 1: The Architectural Solution: A Denormalized Read Model
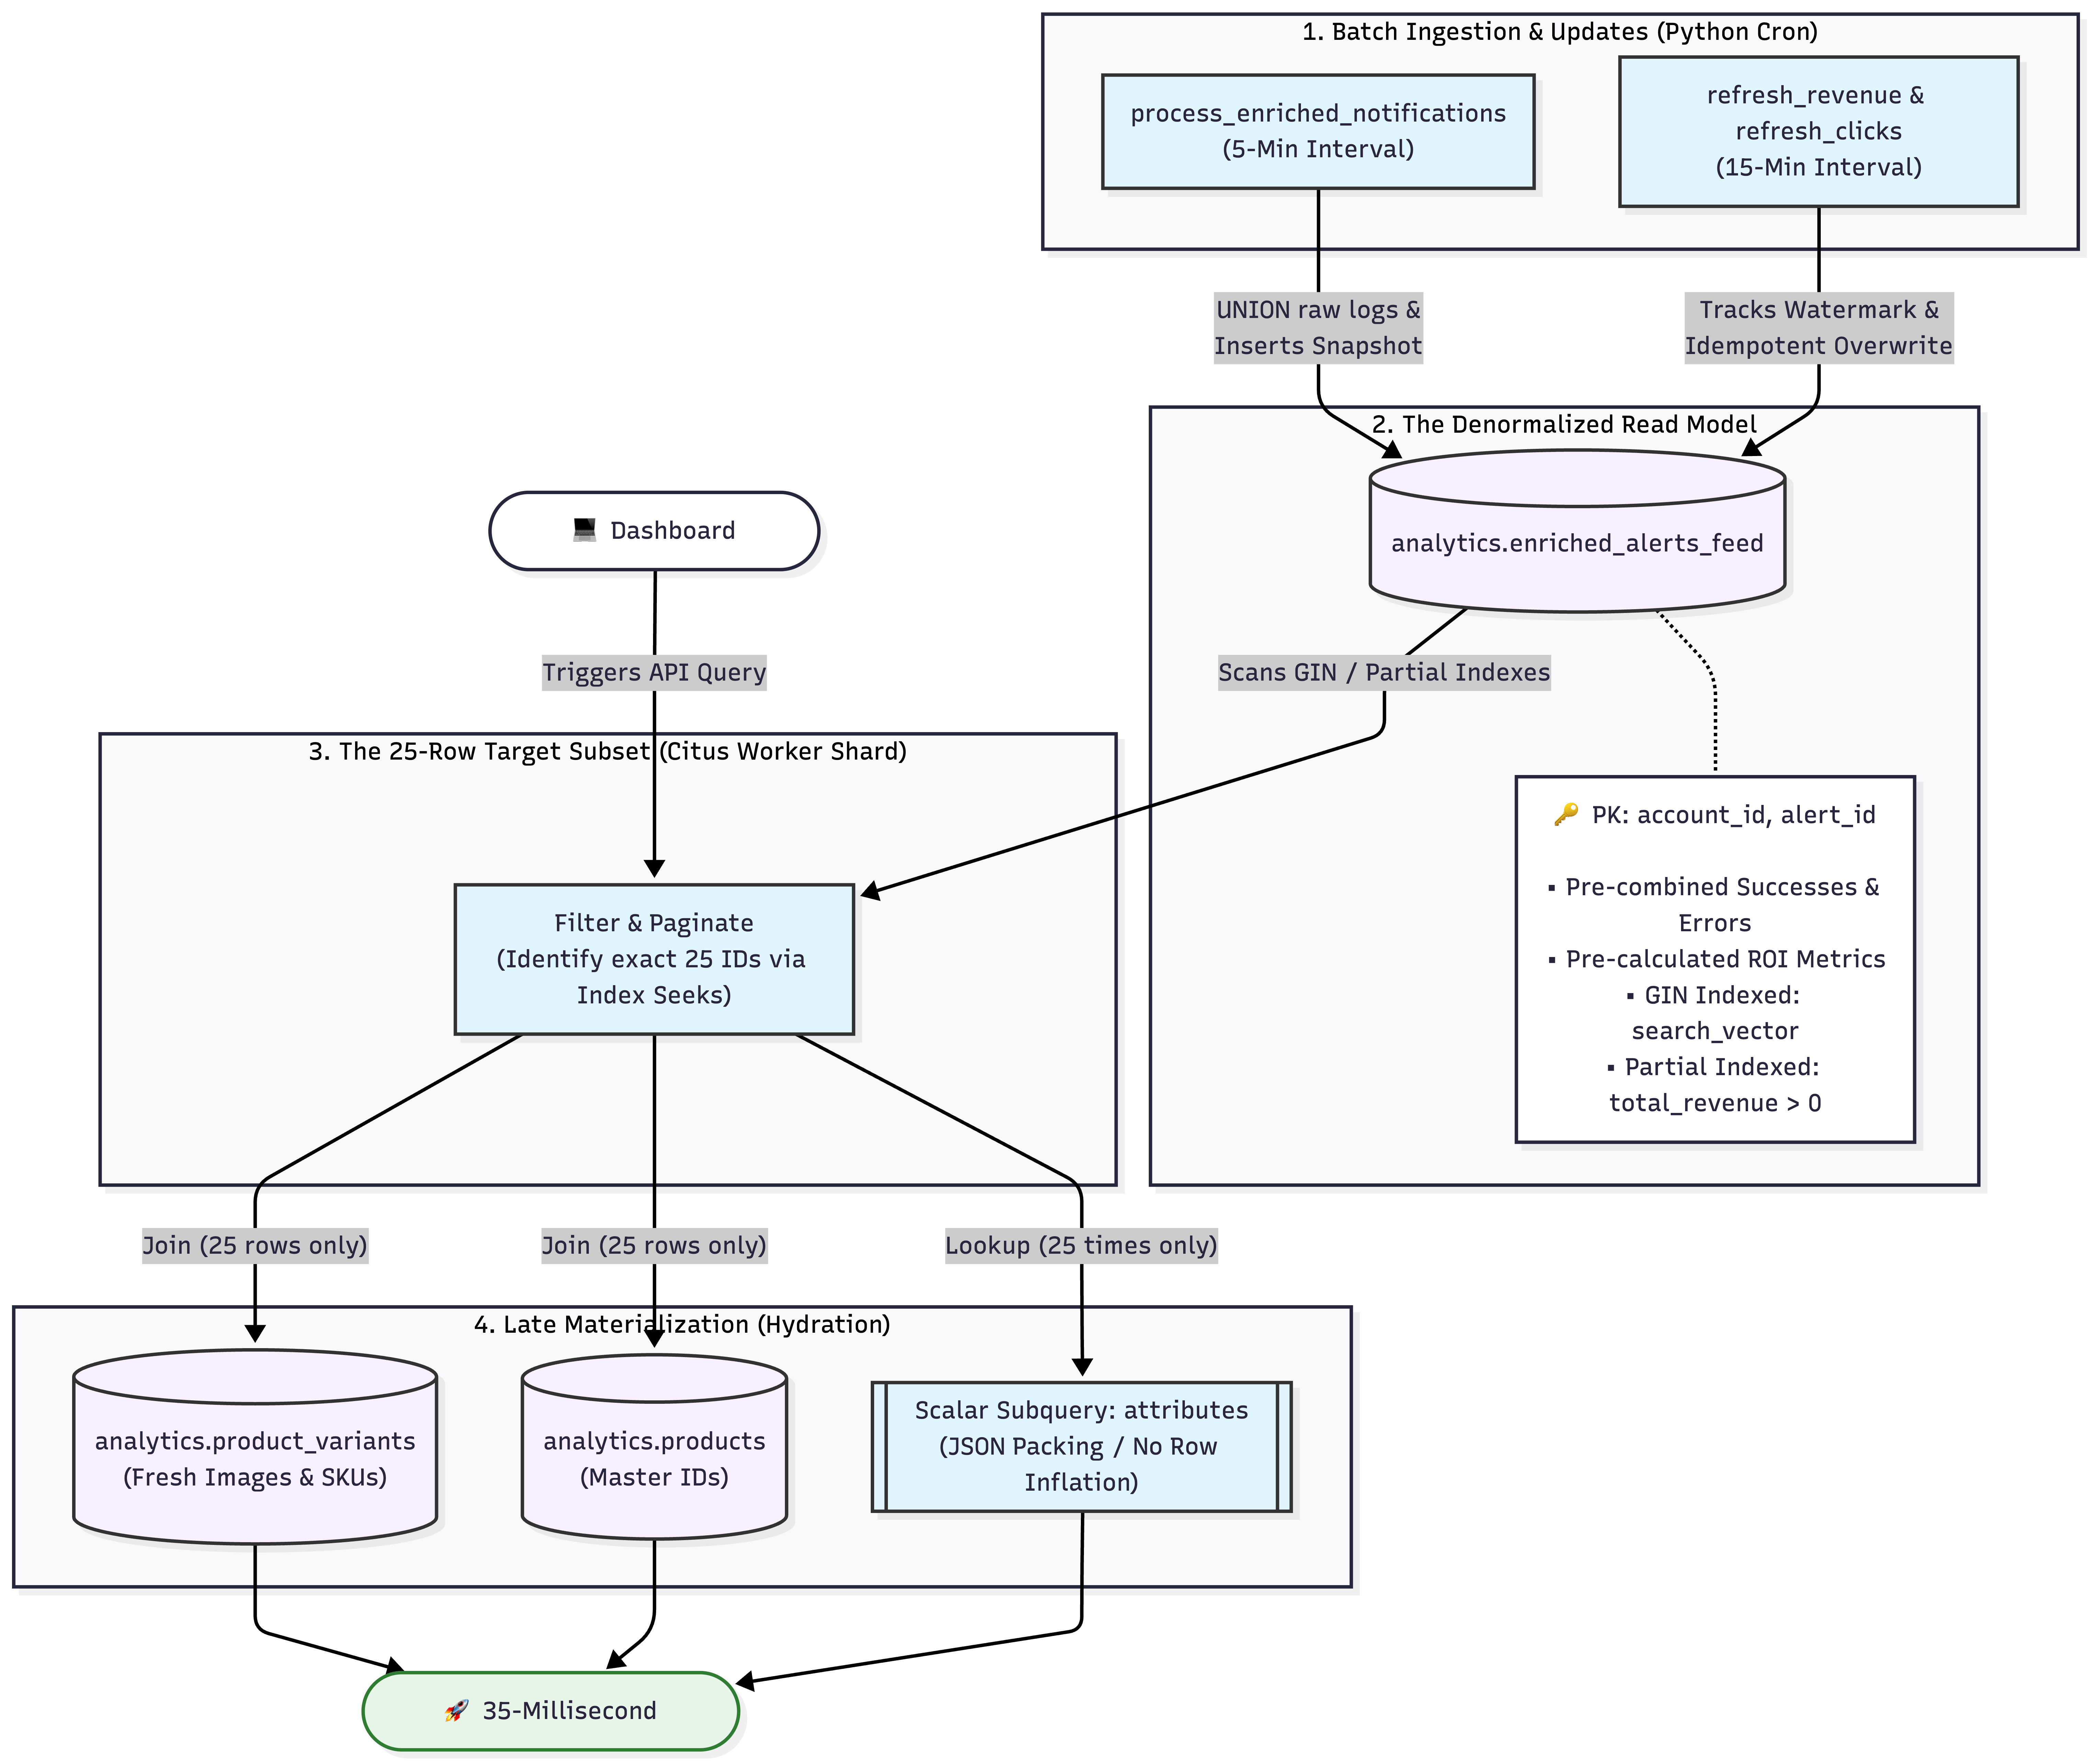
To solve this sustainably, we decoupled our highly write-intensive transactional tables from the analytics layer. We introduced a dedicated read-optimized table called analytics.enriched_alerts_feed, sharded across our database worker nodes by account_id.
We split our data into two distinct classifications:
Immutable Historical Facts: The email address, dispatch channel (email, sms), and alert type (price drop, restocked) never change after transmission. We copy these directly into the new read model, pre-calculating the union between successful dispatches and failures.
Mutable Performance Metrics: Clicks and total revenue fluctuate in the days following a broadcast. These are updated asynchronously via background micro-batches.
By trading a small amount of disk space for massive compute savings, we completely removed the overhead of the dynamic UNION and on-the-fly math.
Step 2: Hitting the Indexing Sweet Spot
A typical store’s conversion rate hovers around 2% to 5%. If we built a standard index on revenue across 131 million rows, the database would waste valuable memory indexing a sea of zeros.
Instead, we built Partial Indexes:
SQL
CREATE INDEX idx_enriched_revenue
ON analytics.enriched_alerts_feed (account_id, sent_date DESC)
WHERE total_revenue > 0;
This tells PostgreSQL: Only index rows that actually made money. This index is tiny, lives entirely in RAM, and allows a dashboard filter like "Show me only conversions" to execute via an instant index seek in under 15 milliseconds.
The Multi-Column “Google Bar” Search
Users wanted a single search bar to look up a customer’s email, a specific SKU, or an external platform ID simultaneously. Instead of chaining heavy OR predicates that confuse the query planner and break index adoption, we created a single search_vector text field.
At the exact millisecond an alert read-model entry is created, we evaluate the entity data and snapshot a lowercase string directly into a GIN Trigram Index:
SQL
CREATE INDEX idx_enriched_search_vector
ON analytics.enriched_alerts_feed USING GIN (search_vector gin_trgm_ops);
Fuzzy substring queries like WHERE search_vector ILIKE '%nike%' now evaluate instantly across billions of characters.
Step 3: Architecting an Idempotent Revenue Pipeline
Computing the financial attribution tied to an alert means matching dispatches to downstream user clicks, and then matching those clicks to final receipts.
Running an aggregate calculation over a 6-month window is devastating for performance. To solve this, we track a persistent cursor in a metadata table and process updates incrementally every 15 minutes.
To ensure the process is entirely production-grade and retry-safe, the pipeline avoids additive accumulation (total_revenue = total_revenue + new_value), which would double-count sales if a job failed halfway through and restarted. Instead, it utilizes an Absolute Overwrite snapshot pattern:
SQL
-- An idempotent, retry-safe metric update block
WITH recent_activity AS (
    SELECT attribution_id, account_id, order_line_value
    FROM analytics.windowed_revenue_matches
    WHERE updated_at >= (SELECT last_processed_at FROM analytics.job_cursors WHERE job_name = 'revenue_sync')
    UNION ALL
    SELECT attribution_id, account_id, order_line_value
    FROM analytics.direct_revenue_matches
    WHERE updated_at >= (SELECT last_processed_at FROM analytics.job_cursors WHERE job_name = 'revenue_sync')
),
absolute_totals AS (
    SELECT a.alert_id, a.account_id, SUM(ra.order_line_value) as fresh_sum
    FROM recent_activity ra
    JOIN analytics.click_attributions a USING (attribution_id, account_id)
    GROUP BY a.alert_id, a.account_id
)
UPDATE analytics.enriched_alerts_feed en
SET total_revenue = alt.fresh_sum,
    has_purchase = (alt.fresh_sum > 0),
    is_clicked = true
FROM absolute_totals alt
WHERE en.alert_id = alt.alert_id
  AND en.account_id = alt.account_id;
Step 4: Deferring the Cost with Late Materialization & Lateral Seeks
The final phase of our performance breakthroughs came down to query restructuring. Our API query now enforces Late Materialization.
Instead of joining heavy product titles, text blobs, and asset URLs across millions of records, sorting them, and keeping the top 25, we isolated our layout. We execute the filters, cursor pagination, and search criteria entirely on the optimized enriched_alerts_feed table first.
Once the database identifies the exact 25 or 50 alert_id values needed for the screen, we pass those specific keys into a late, high-speed lookup join to hydrate the human-readable product images and master catalog records.
To resolve the product attribute row inflation, we swapped out the heavy global JOIN and GROUP BY pattern. Instead, we use an isolated scalar subquery lookup that runs exactly 25 times only on the finalized dataset, packing the attributes directly into a clean JSON array without duplicating rows.
6. The Outcome
By treating our database engine as a strategic collaborator; rethinking data access through read models, leveraging partial indexes, and structuring robust, batch-isolated ingestion pipelines, the metrics speak for themselves:
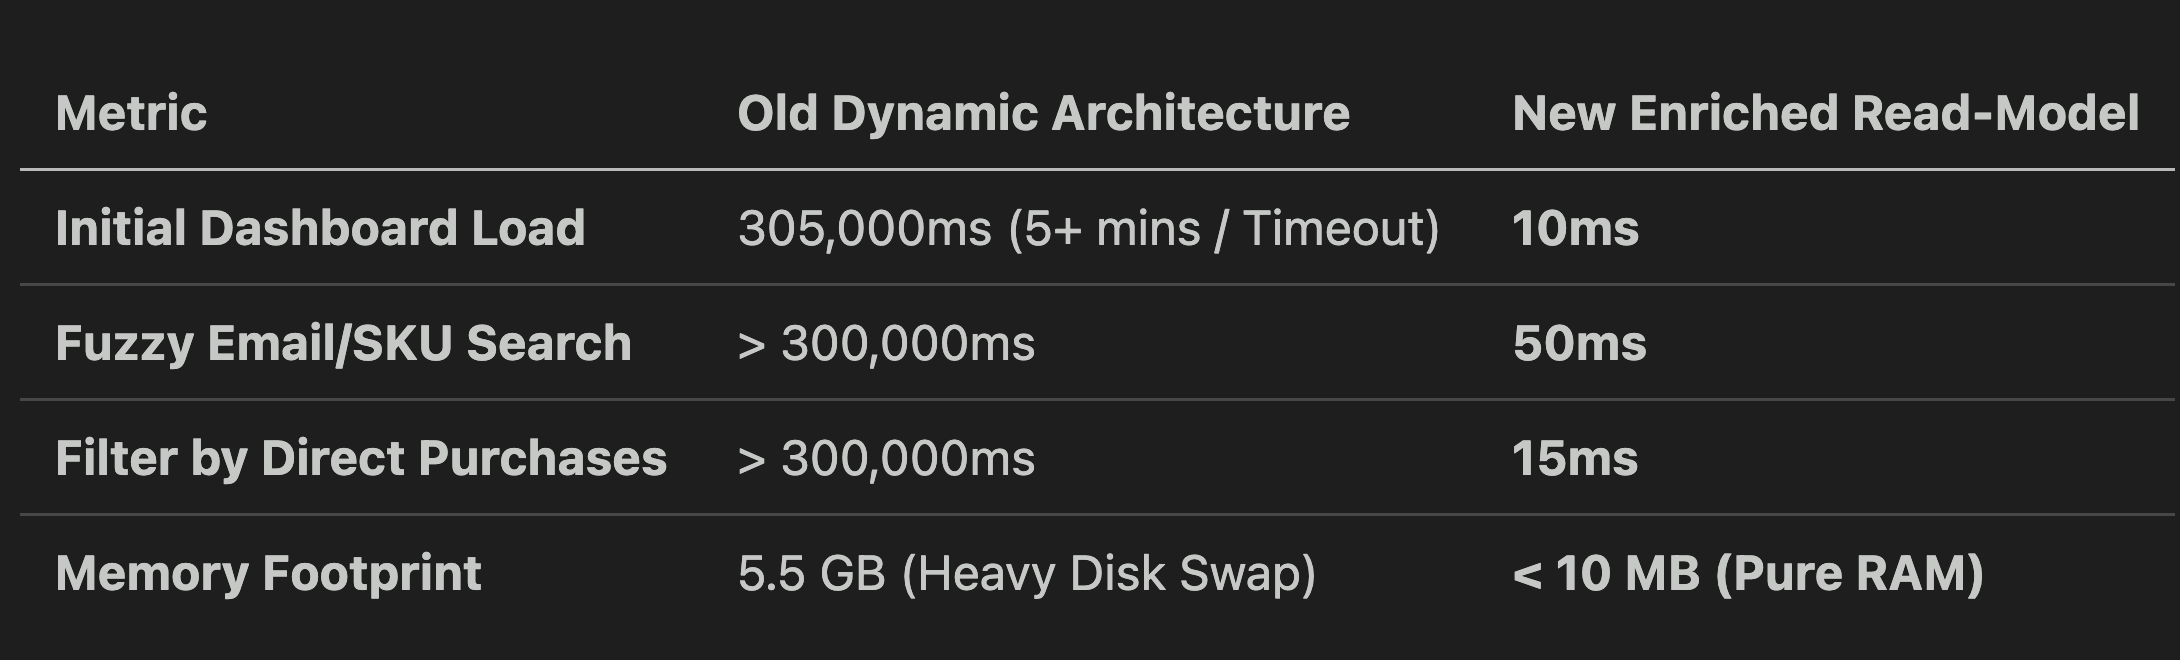
Designing systems to scale seamlessly from millions to billions of rows requires shifting workloads from CPU-heavy on-the-fly aggregations into linear, index-driven seeks. Disk space is cheap; sub-millisecond execution loops are priceless.